
# 1 || Fixed Income Still The Biggest Whale
Fixed Income still dominates, but Equities are closing in! Will Equities overtake Fixed Income?


As of 2022, the Fixed Income markets continued to overshadow Equity markets in size, boasting a total value of $129 trillion compared to the $101 trillion of Equity markets.
Both the US Fixed Income and US Equity markets dwarf the aggregated European markets in size, being roughly 2.3 times and 4 times the size, respectively.
US Treasuries Constitute Approximately 50% of US Fixed Income Value
Global Equity Market growth has outpaced Global Fixed Income markets by about 2 times between 2008 and 2022, as measured by CAGR.
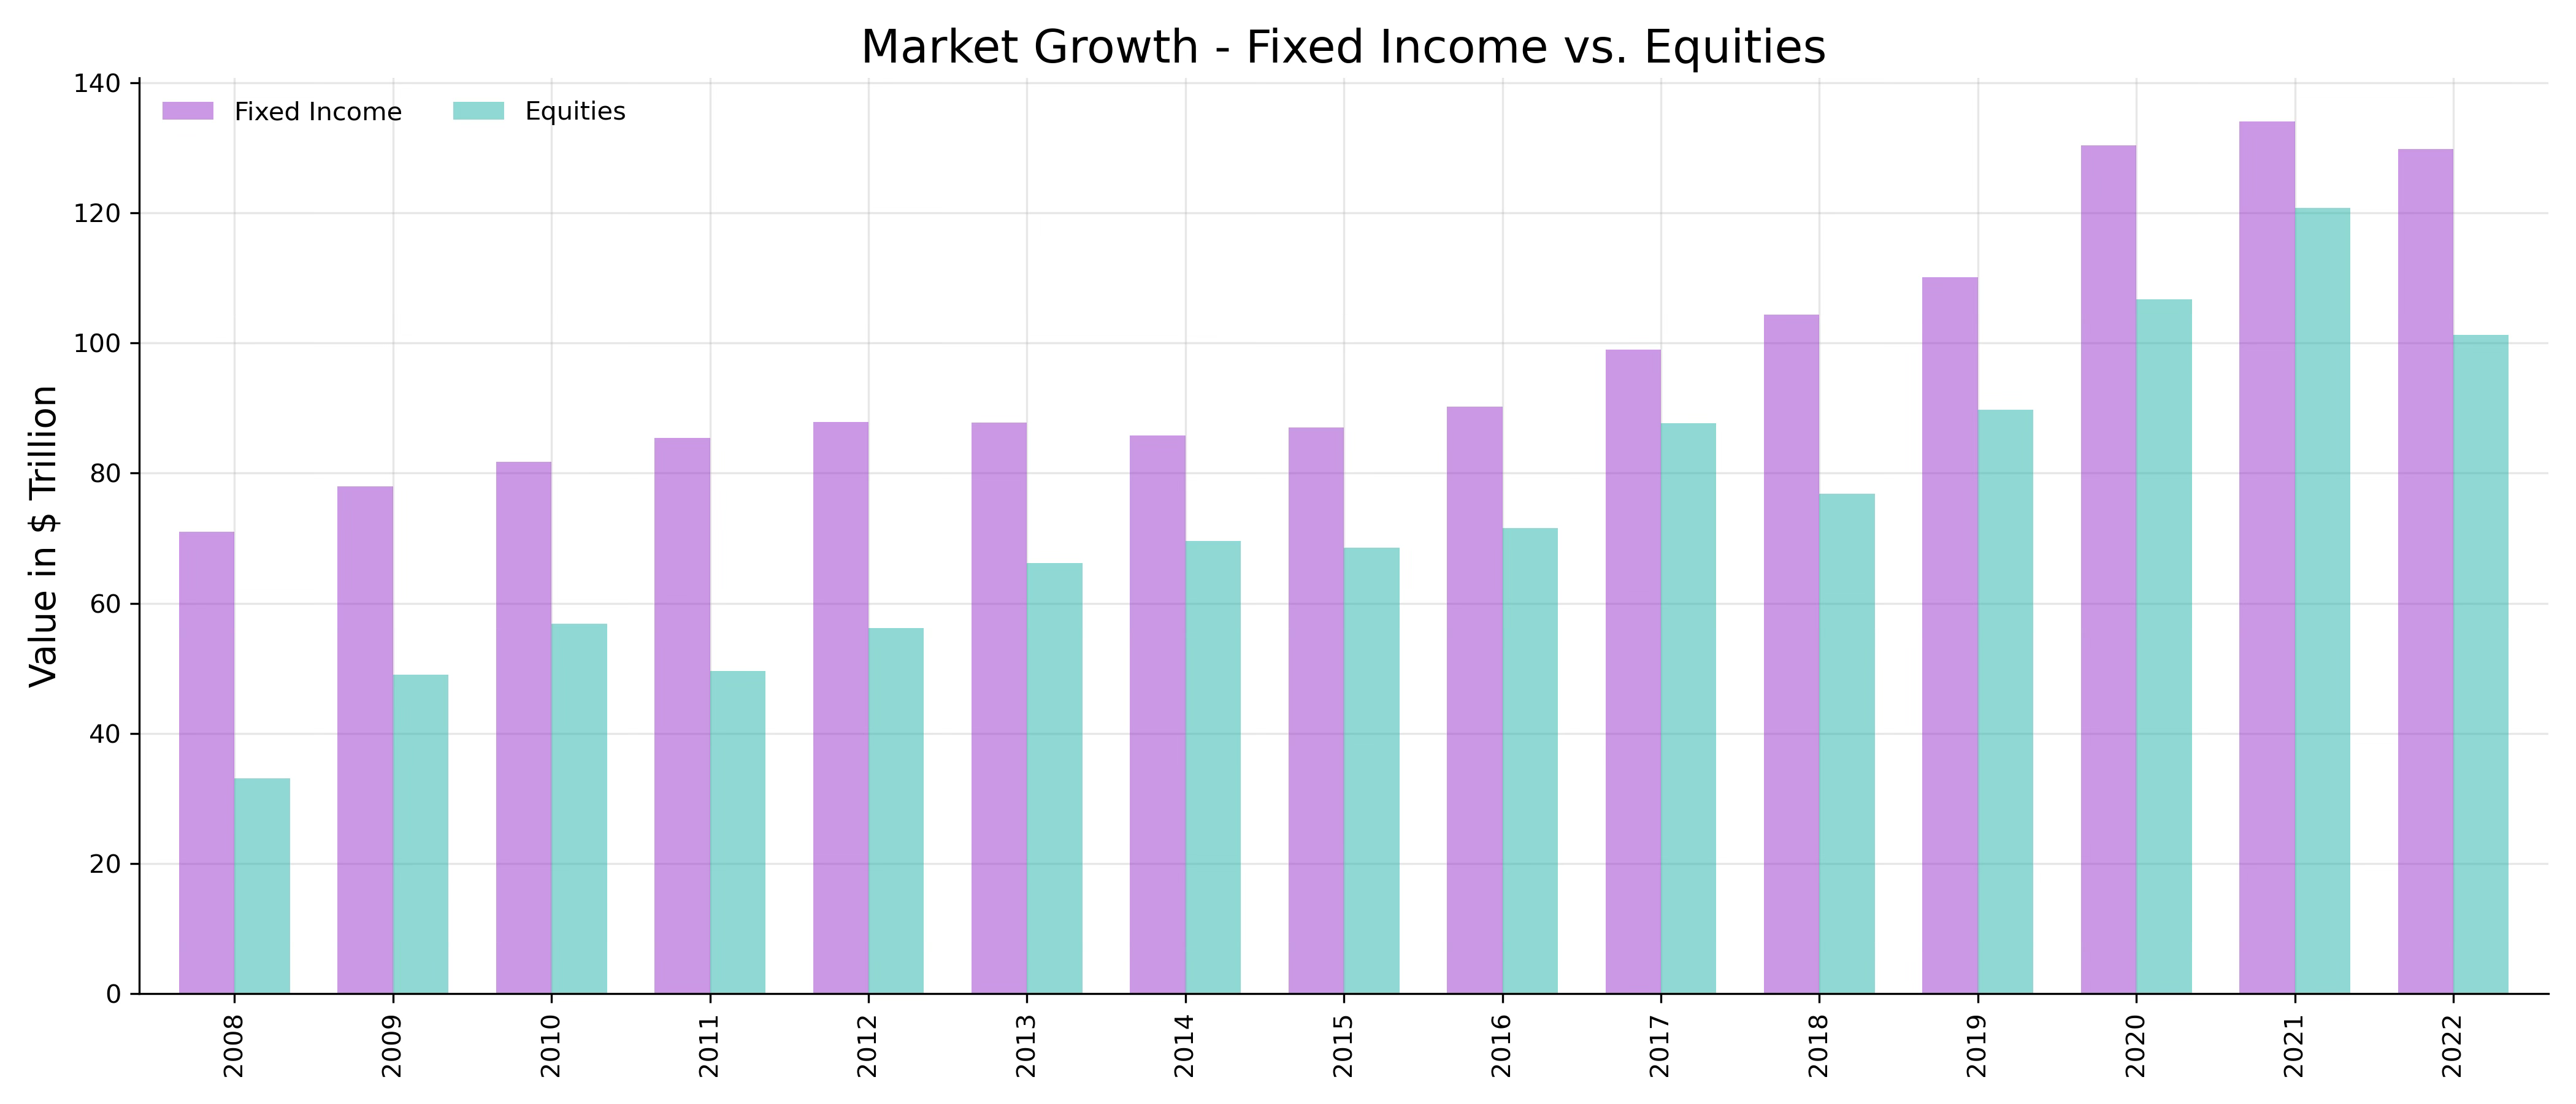
Historically, fixed income markets have overshadowed equity markets. In 2008, aggregated fixed income markets were more than twice the size of equity markets. However, since then, the trend has been shifting, with equity markets gaining ground.
In 2008, fixed income markets boasted an aggregate outstanding value of about $71 trillion, dwarfing the $33 trillion value of equity markets. Since then, both markets have experienced substantial growth, but the disparity between them has been narrowing.
By 2022, fixed income markets had an aggregated outstanding value of about $129 trillion, compared to approximately $101 trillion for equity markets. This represents a significant reduction in the gap, with fixed income markets now only 1.3 times the size of equity markets, down from a multiple of about 2.3 in 2008.
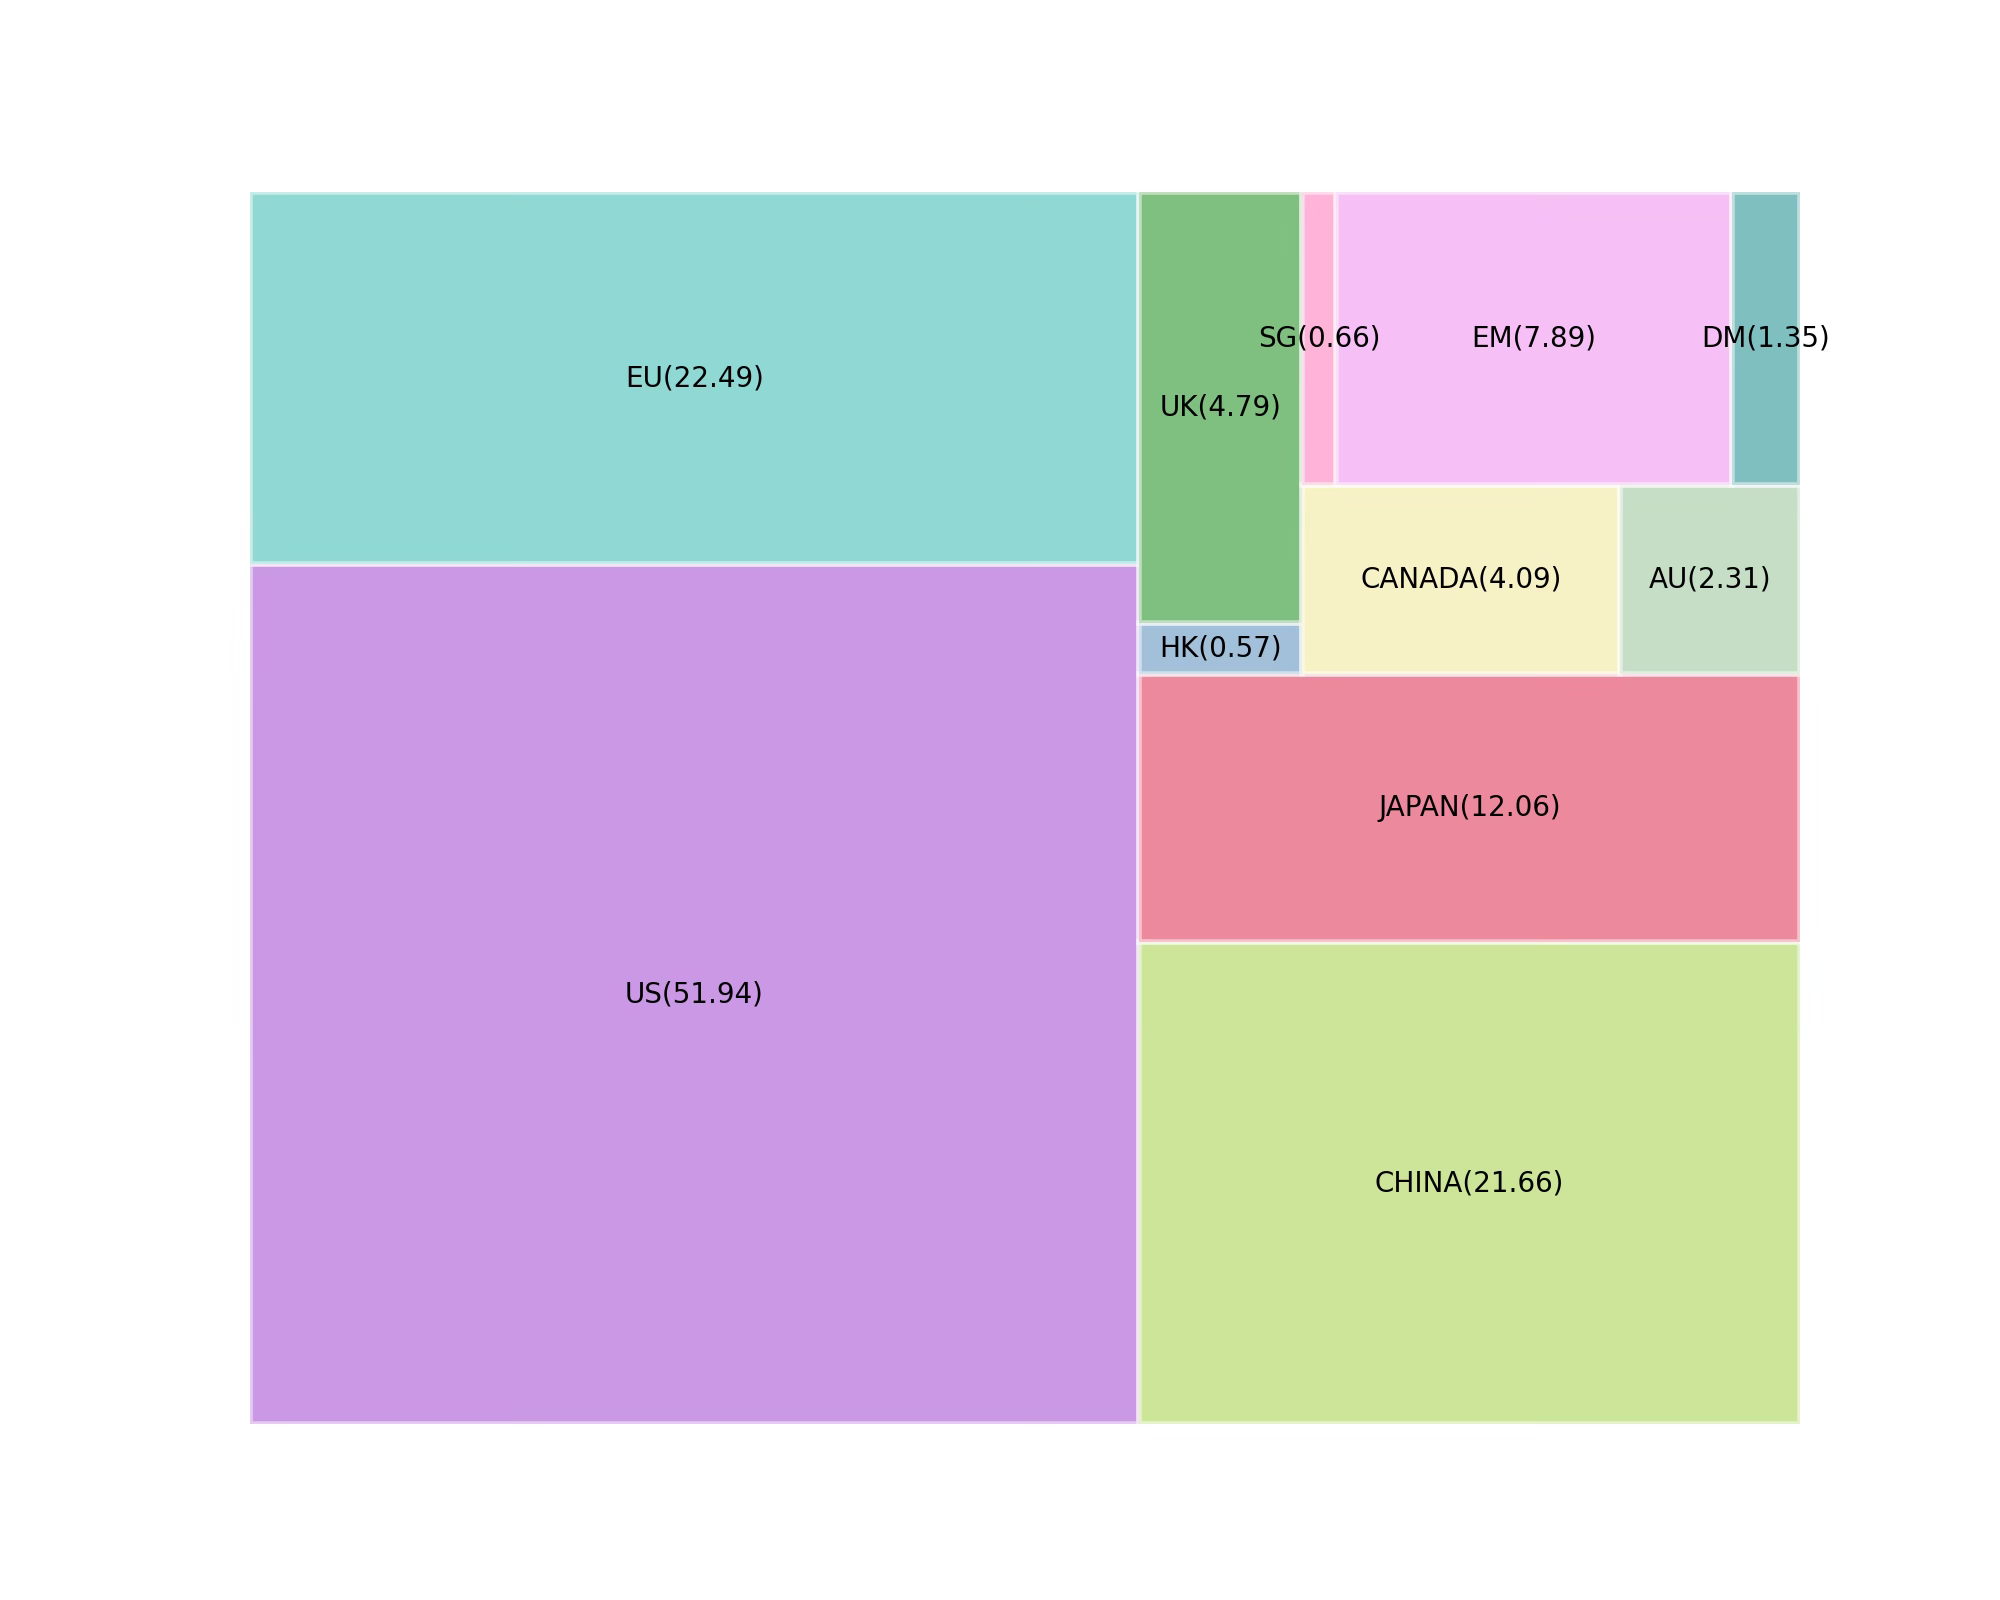
The US fixed income markets stand as the world's largest, boasting a size twice that of both the Chinese market and the aggregated EU fixed income markets. With an outstanding value of $52 trillion in 2022, the US fixed income markets accounted for approximately 40% of the aggregated global fixed income markets. A significant portion, about half of the $52 trillion outstanding value, comprised US Treasuries.
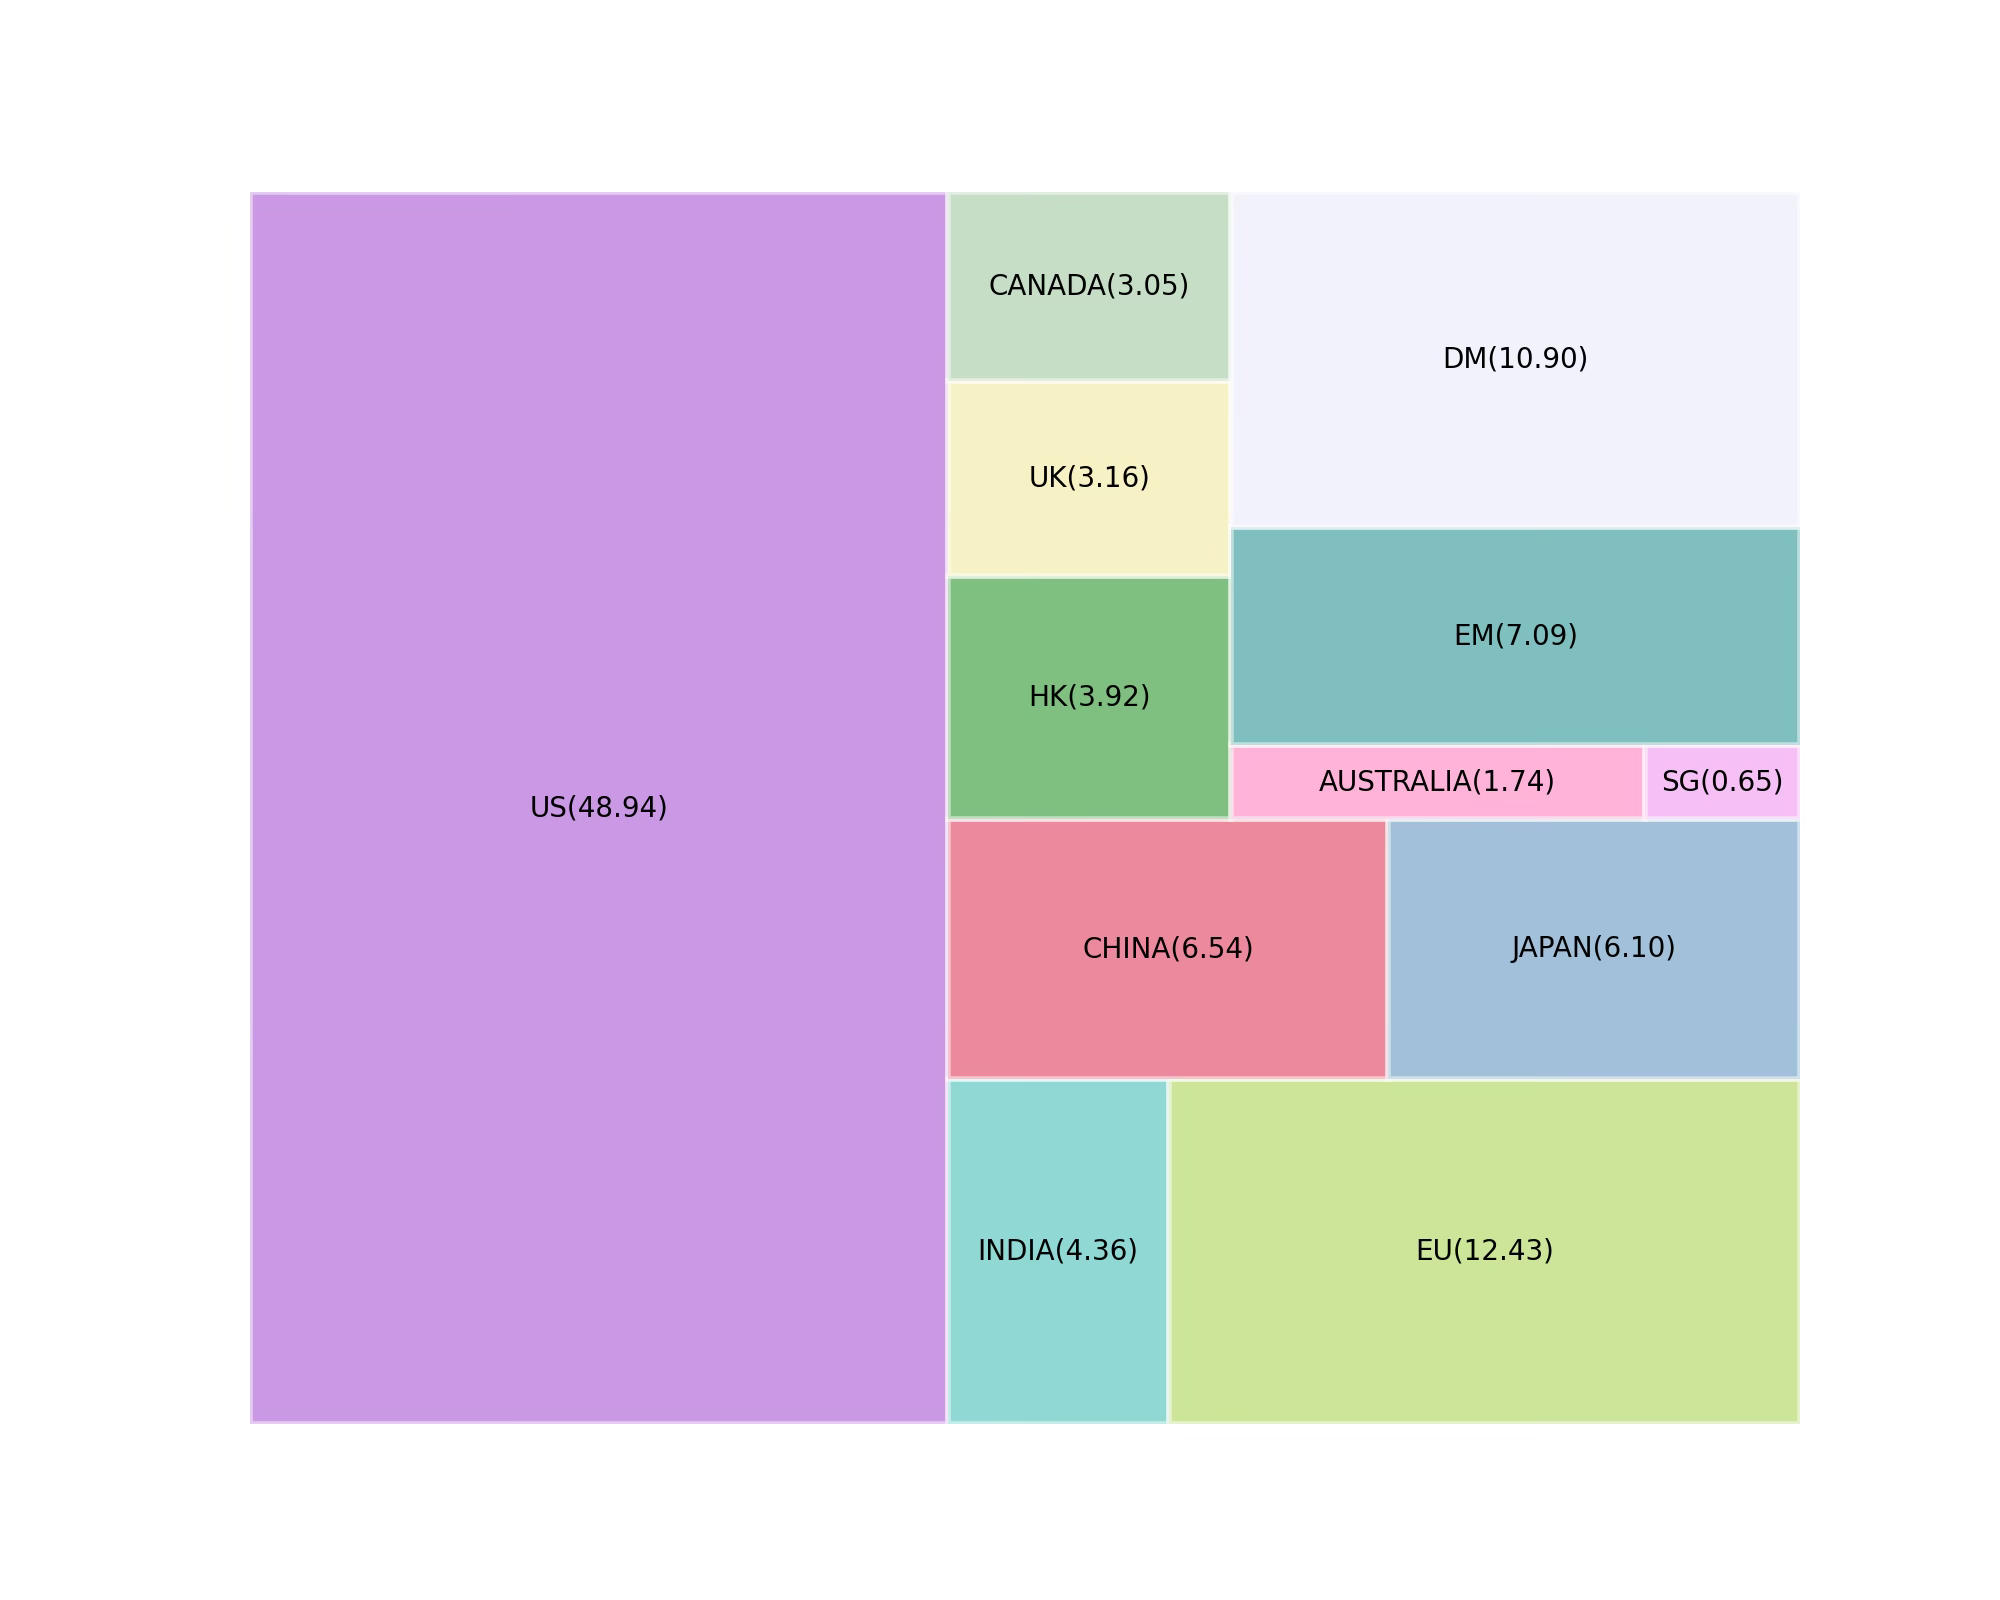
In 2022, the US equity market boasted the highest market capitalization, valued at approximately $49 trillion. This figure was nearly four times the market capitalization of European markets, collectively constituting the second-largest market. Moreover, the US market accounted for about 45% of the global market.
While the global fixed income market has historically been larger than global equities, a significant shift has occurred. Between 2008 and 2022, measured by Compound Annual Growth Rate (CAGR), global equities growth outpaced global fixed income growth by approximately two times. This trend appears to have remained consistent, with only occasional short-lived disruptions, likely attributable to economic and interest rate uncertainty.
A commonality during this period has been historically low interest rates, which persisted until the outbreak of the pandemic in 2020. Interest rates remained low over an extensive period, with only an increase occurring in 2016. Following the interest rate hike in 2016, there was a notable surge in fixed income outstanding value, marking a significant increase after a prolonged period of stagnation.
Even after central banks once again lowered interest rates during the pandemic, the surge in fixed income markets seemed unabated, demand continuing. This continued momentum may have been fueled by concurrent government spending initiatives undertaken during the same period. This trend appears likely to have continued in 2023 and it is plausible it might persist in 2024, given the prolonged high rates and ongoing government spending.
During the periods of uncertainty we have experienced over the last one and a half decade, both retail and institutional investors appear to maintain strong confidence in equity markets, propelling several markets to record highs. The question of whether market capitalization will exceed the outstanding value of fixed income in the coming years remains to be answered.
For now, Fixed Income is still the Whale.